- The crypto market suffered a brutal one-day crash on January 29, erasing over $110 billion in total market value.
- More than 267,000 traders were liquidated, with $1.68 billion wiped out in 24 hours.
- U.S. spot Bitcoin ETFs recorded $817.8 million in net outflows, led by BlackRock’s IBIT and Fidelity’s FBTC.
The cryptocurrency market experienced a sharp sell-off on January 29, 2026, with more than $110 billion erased from total market capitalization in one day. Bitcoin and altcoins fell hard, triggering widespread panic among traders.
Massive Liquidations Crush Leveraged Positions
Forced liquidations reached extreme levels. According to CoinGlass data, 267,436 traders were liquidated in the past 24 hours, with total losses amounting to $1.68 billion.
Long positions suffered the most, accounting for $1.57 billion of the damage, while shorts lost $117.72 million.
The largest single liquidation was a $80.57 million BTC-USDT position on HTX. Over shorter time frames, the numbers remained brutal: $1.12 billion in the last 12 hours and $834 million in the last 4 hours.
These cascading liquidations accelerated the downward pressure as positions were automatically closed.
Spot Bitcoin ETFs Record Heavy Outflows
Meanwhile, the U.S. spot Bitcoin ETFs saw significant redemptions on Thursday. Data shows a net outflow of $817.8 million on January 29, the largest single-day withdrawal in recent weeks.
BlackRock’s IBIT led the outflows with -$317.8 million, followed by Fidelity’s FBTC at -$168 million. Grayscale’s GBTC recorded -$119.4 million in outflows. This reversed several days of modest inflows and marked a clear shift in institutional sentiment on that day.

The broader crypto market felt the pain. Total market capitalization dropped to around $2.83 trillion, down sharply from levels above $2.95 trillion earlier in the week. The decline reflected broad-based selling across Bitcoin and major altcoins.
Bitcoin Wyckoff Accumulation Pattern Emerges
The BTC/USDT chart highlights a potential Wyckoff accumulation schematic. The chart maps the price action from November 2025 through late January 2026, labeling distinct phases (A through E).
Key points include on the pattern include a prolonged downtrend followed by sideways consolidation. The support is near $80,000, and the resistance is around $100,000–$110,000.
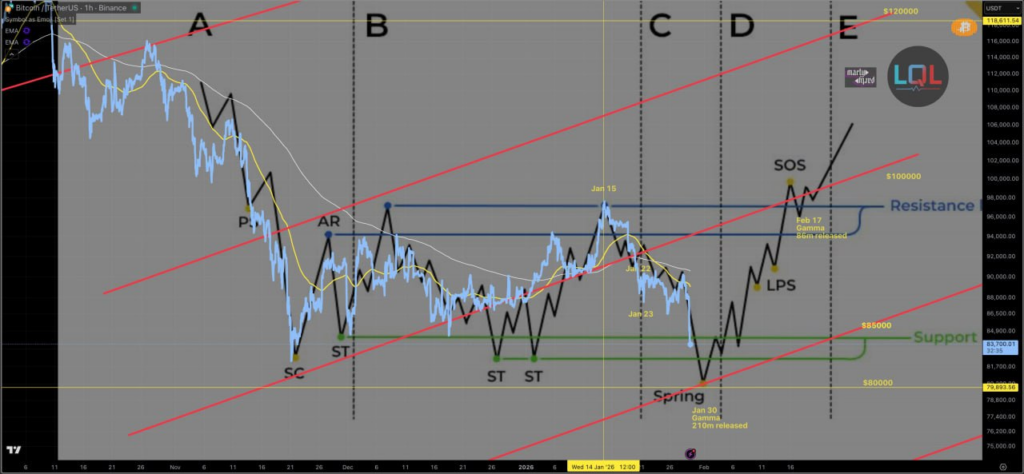
Analysts using the Wyckoff method interpret this structure as large players accumulating Bitcoin at lower prices while shaking out retail leverage.
The pattern suggests the current range is designed to create maximum pain before an eventual markup phase. The price is being “held in this accumulation range” to force out weak hands.
As of January 30, the market remains volatile. Traders are watching key support levels closely, with many hoping the worst of the selling is over.
What’s your Reaction?
+1
0

+1
0

+1
0

+1
0

+1
0

+1
0

+1
1